Cardiovascular Reflexes
Objective:
To explain in a short essay or a diagram the blood pressure, heart rate, and pO2 that occurs during changes in posture and exercise, at the level of 85% proficiency for each student.
In order to achieve this objective, you will need to be able to:
1. Measure blood pressure, heart rate and pO2 during sitting, reclining, standing, and exercise.
- Measure differences in the cardiovascular responses of well conditioned and poorly conditioned individuals.
- Explain why blood pressure, heart rate, and pO2 change during changes in posture and during exercise.
Methods and Results
Posture
To monitor circulatory adjustments to changes in position, take blood pressure and pulse measurements under the conditions of sitting, reclining, and standing noted in Table I. Measure Arterial pressure using the the sphygmomanometer. Measure Heart rate and pO2 using the Nonin Pulse Oximeter shown below. Record your results in Table 1.
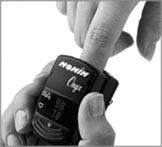
Table 1 Posture
|
|
TRIAL 1 |
TRIAL 2 |
||||
|
Sitting quietly |
BP |
HR / pO2 |
BP |
HR / pO2 |
||
|
Reclining for 3 min |
|
|
|
|
|
|
|
On standing |
|
|
|
|
|
|
|
After standing for 3 min |
|
|
|
|
|
|
Exercise
You will be working in groups of four, duties assigned as indicated above, except that student 4, in addition to recording the data, will act as the timer and call the cadence.
Any student with a known heart problem should refuse to participate as the subject.
All four students may participate as the subject in turn, if desired, but the bench stepping is to be performed at least twice in each group--once with a well-conditioned person acting as the subject, and once with a poorly conditioned subject.
Bench stepping is the following series of movements repeated sequentially:
- Place one foot on the step.
- Step up with the other foot so that both feet are on the platform. Straighten the legs and the back.
- Step down with one foot.
- Bring the other foot down.
The pace for the stepping will be set by the "timer" (student 4), who will repeat "Up-2-3-4, up-2-3-4" at such a pace that each "up-2-3-4" sequence takes 2 sec (i.e., 30 cycles/min).
- Student 4 should obtain the step
(20-in. height for male subject, or 16
in. for a female subject) while baseline
measurements are being obtained on the
subject.
- Once the baseline pulse and
blood pressure measurements have been recorded
on Chart 2, the subject is to
stand quietly at attention for 2
min to allow his or her blood pressure
to stabilize before beginning to step.
- The subject is to perform the
bench stepping for as long as possible,
up to a maximum of 5 min, according
to the cadence called by the timer.
The subject is to be watched for
and warned against crouching (posture must
remain erect). If he or she is
unable to keep the pace for a
span of 15 sec, the test is to
be terminated.
- When the subject is stopped
by the pacer, stops voluntarily because
he or she is unable to continue,
or has completed 5 min of bench stepping,
he or she is to sit down. The
duration of exercise (in seconds) is
to be recorded, and the blood pressure
and pulse are to be measured immediately
and thereafter at 1-min intervals for 4
min post-exercise.
- Record the test values on Table 2, and repeat the testing and recording procedure with the second subject
Table 2 Exercise
|
Harvard Step Test |
Interval Following Test |
|||||||||
|
|
Baseline |
Immediately |
1 min |
2 min |
3 min |
|||||
|
|
BP |
HR pO2 |
BP |
HR pO2 |
BP |
HR pO2 |
BP |
HR pO2 |
BP |
HR pO2 |
|
Well conditioned |
|
|
|
|
|
|
|
|
|
|
|
Poorly conditioned |
|
|
|
|
|
|
|
|
|
|
- The subject's index of physical Fitness is calculated using the formula below:
|
|
duration of exercise in seconds x 100 |
|
Index = |
————————————————— |
|
|
2 X sum of the 3 pulse counts in recovery |
Scores are interpreted according to the following scale:
|
below 55 poor physical condition |
72 to 79 high average |
|
55 to 62 low average |
80 to 89 good |
|
63 to 71 average |
90 and over excellent |
Discussion
- When did you notice a greater elevation of blood pressure and pulse? Explain.
- Was there a sizeable difference between the after-exercise values for well-conditioned and poorly conditioned individuals? Explain.
- Did the diastolic pressure also increase?
© David G. Ward, Ph.D. Last modified by wardd 23 May, 2006